From Signup to Success: How to Fix a 20% Onboarding Rate
The Problem:
Your SaaS company has amazingly successful signup rate of 1,000/signups per month.
The activation onboarding rate is only 20%.
Identifying the “Friction Gap” in drop-off rates in Onboarding.
Define the "Aha! Moment”:
As PMM our goal is to define the “aha! Moment” for the users. We need to ask, When does the user experience meaningful value tied to retention?
Answer: When the user creates projects, adds tasks, collaborates with a team member and incorporates into real-world workflow process.
Main Goal is "incorporating into real-world workflow," as PMM your job is to reduce the cognitive load required to get there.
Tip: (Only thought about this later) Think about Retention - Success should also mean users stick around for the next 90 days.
Hypothesis:
Hypothesis A (The Friction Gap): We are treating all 1,000 signups the same. The drop-off is happening because the onboarding isn't tailored to the specific use case or persona (e.g., a Manager vs. an Individual Contributor) selected during signup.
Hypothesis B (The Value Gap): Users understand what buttons to click, but not why. The messaging is functional ("Click here to add a task") rather than aspirational ("Organize your week in seconds"). We aren't selling the transformation.
Hypothesis C (The "Blank Page" Syndrome): We lack "Social Proof" or real-world templates within the product. Users need to see how others in their industry succeed to feel confident.
Measuring The Data:
Cohort Analysis: Break down the 80% drop-off. Is it happening at a specific screen (e.g., the "Invite Team" step)?
In-App Surveys: Trigger a "What stopped you today?" micro-survey for users who idle for 2+ minutes on the setup page.
A/B Testing Messaging: Test a "Template-first" onboarding flow against the current "Blank Canvas" flow.
Onboarding Optimization:
Time-to-Value (TTV) Reduction:
Quick-win prioritization: Reduce steps in onboarding process for TTV. Change “submit” button copy to “See My Dashboard.” This reduces the Value Gap.
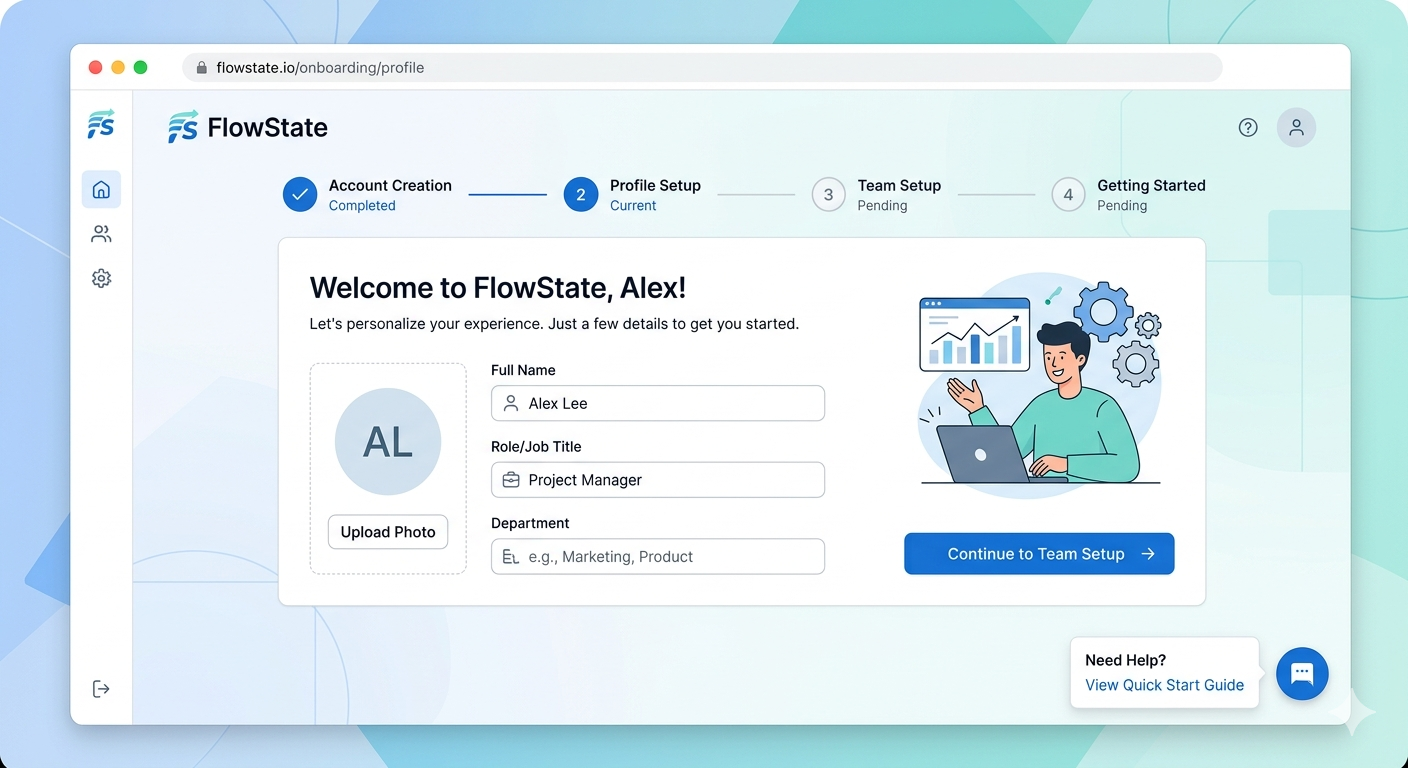
Hypothesis A (The Friction Gap): Create specific tailored dashboards for specific case or persona (e.g., a Manager vs. an Individual Contributor) selected during signup.
Hypothesis B (The Value Gap): Sell “Transformation” not “Function.” Change tutorial from “Add Task” to “Organize your week in seconds" or “Create Data Chart.”
Hypothesis C (The "Blank Page" Syndrome): Creating 3 real-world working templates that users can interact with and add to
Success Beyond the 20%:
Once the needle moves from 20% to
New North Star Metric: Shift focus from vanity metric of “signups” to “weekly active users”
Retention: Measure Active Users past 90 days.
Conclusion: Onboarding Is Your First Impression - Don’t Waste It.
Onboarding isn’t just a technical checklist of features. It’s the first impression of the “Emotional Journey” for your client. It’s the first stage in moving your user from “curious” to “confident” in the shortest amount of time.
Solve for the “Aha! Moment”, Not the “Setup”: Users don’t sign up for configure settings, they signed up to solve their problem. Every field you can remove to get them to solving thier probelm faster is the goal.
Personalization is the New Standard: All 1,000 signups are not the same and treating them as such is a recipe for high churn rates. Use persona-based branding to ensure a Manager sees the high-level dashboard, verses an Individual Contributor sees the task-triage they need.
Onboarding Doesn’t End: Activation isn’t just a one-time event. As your software evolves so does your users needs. This means that onboarding is a never-ending project with consistant audits for “Friction Gap” to ensure the “Aha! Moment” of today isn’t the reason for churn tomorrow.